Modelling a dam to calculate a seepage line requires careful discretisation. The sealing core of a dam usually has a hydraulic conductivity value that is several orders of magnitude lower than that of the surrounding dam material. This can lead to oscillations in the flow calculation if the element size is not adjusted step by step.
The following image shows the minimum model data required for a dam:
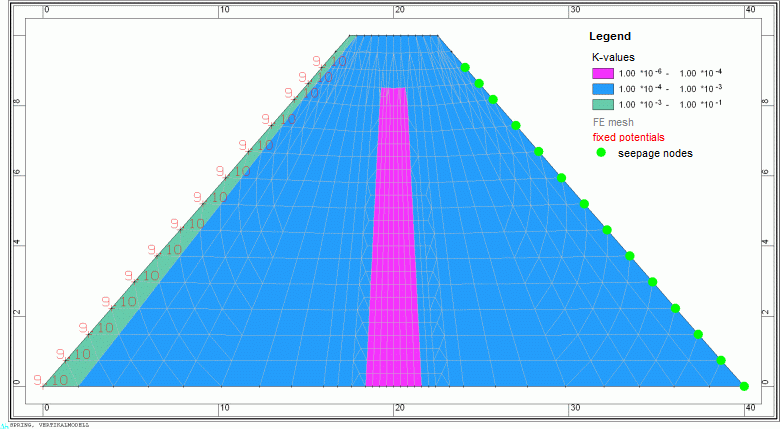
Model data of a dam (double superelevation in y-direction)
The following parameters are included in the flow calculation:
POTE: at the water-side edge nodes in metres above sea level (elevation of the water level)
KWER: green = 0.001 m/s, blue = 0.0001 m/s, pink = 0.000001 m/s
MAEC: horizontal expansion (user defined)
SICK: at the land-side edge nodes up to the elevation of the water level (value = 0.0)
After a steady state flow calculation (10 iterations), the following flow pattern is obtained:
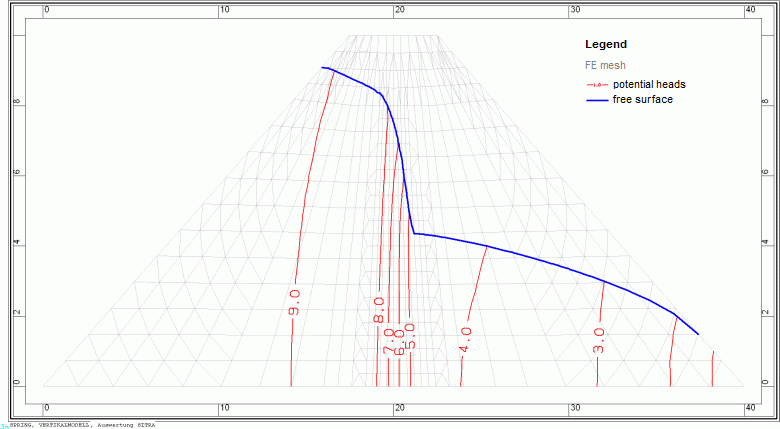
Result data potential heads and seepage line of the dam
The position of the seepage line (blue) corresponds to the calculated free surface.
Seepage water emerges from the intersection of the seepage line with the land side of the dam. In the example, this occurs at the lower three nodes above the right foot of the dam. The seepage rate at the nodes can be imported into SPRING via Attributes  Import model data/result data... Seepage rate [m³/node/TU] to any identifier, visualised via View Show attributes Attributes Isolines/area plots/values and read off with Attributes Edit nodes Pick. The total rate is calculated per running metre of dam.
Stand: 18.04.2025 | 